
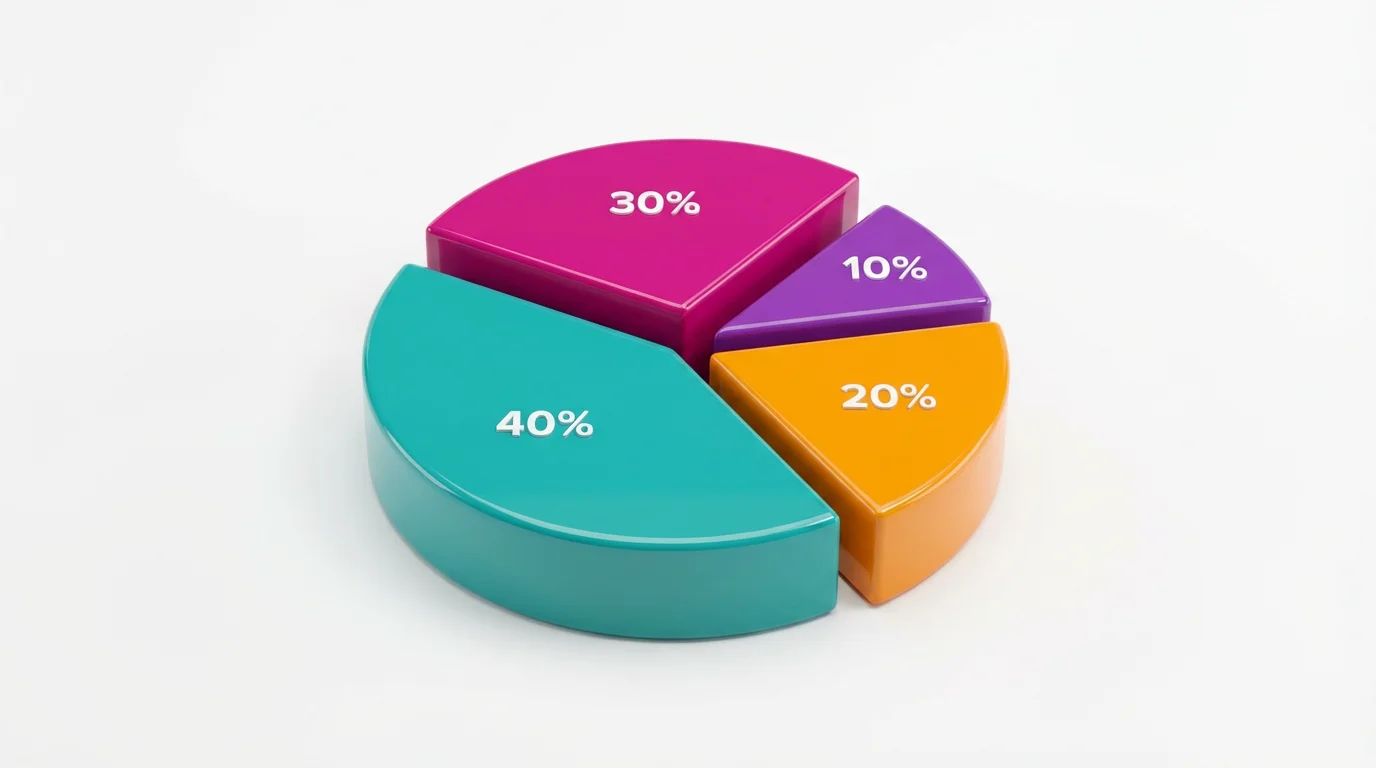
Simply type your data directly into the prompt box. For best results, list each category and its corresponding value or percentage. For example: "A pie chart showing favorite fruits: Apples 40%, Bananas 30%, Oranges 20%, Grapes 10%".
My favorite app
Great app, easy to use. Helps our small business save time and money to create different marketing materials professionally. Thank you.